Interactions
Every response your team gave a Baz review comment, filterable and exportable.
The Interactions page shows how your team engages with Baz review comments. Each row is one user interaction with one comment, which makes it the place to see which agents are useful, where feedback confuses people, and which findings get ignored.
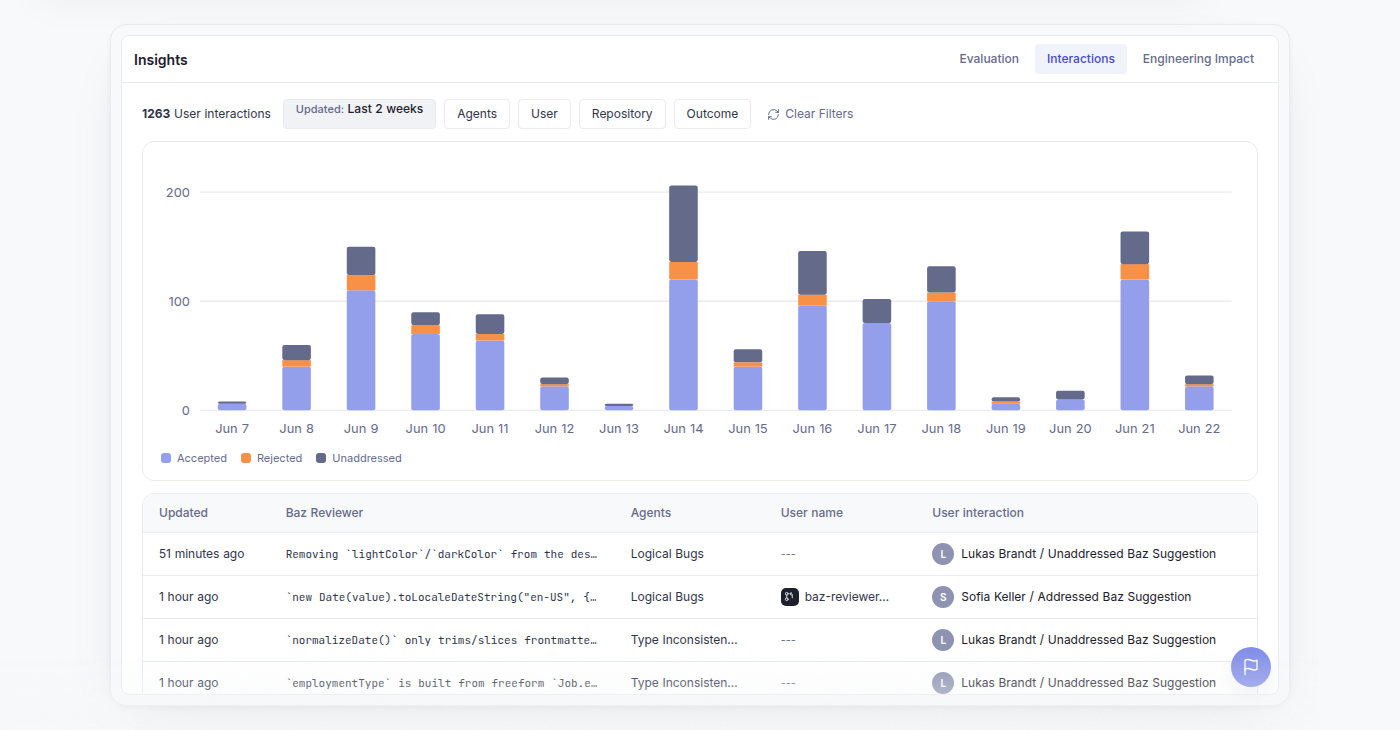
Above the table, a stacked chart breaks interactions down over time into accepted, rejected, and unaddressed, so a shift in behavior is visible before you read individual rows. The chart can be hidden when you only want the table.
The table
| Column | Description |
|---|---|
| Updated | When the interaction happened |
| Baz Reviewer | The comment the agent generated |
| Agents | The agent that produced the comment, for example Logical Bugs |
| User name | The Baz or provider user who responded |
| User interaction | The reply or reaction the user gave |
Selecting a row opens a drawer with the full discussion behind that interaction, so a rejected finding can be read in context rather than judged from one line.
Filters
| Filter | Description |
|---|---|
| Updated | Last day, last week, last 2 weeks, last month, or last 6 months. Defaults to last 2 weeks |
| Agents | Narrow to the agents that produced the comments |
| User | Narrow to specific team members |
| Repository | Narrow to specific repositories |
| Outcome | Accepted, rejected, or unaddressed |
| Author Only | Count only interactions from the change author, which needs a user selected first |
The interaction count beside the filters always reflects the active selection, so it doubles as a check that a filter did what you expected.
Exporting
The filtered set exports to CSV for offline analysis. Export covers windows up to last month, so choose last day, last week, last 2 weeks, or last month first. It stays disabled for a 6 month window and when the current filters return no rows.
FAQ
What is tracked on the Interactions page?
One row per user response to a Baz review comment: who responded, what they said or reacted with, the original comment, the agent behind it, and when it happened.
How can I narrow the data?
Filter by time window, agent, user, repository, and outcome, and optionally restrict to the change author. Both the chart and the row count follow the active filters.
Why is the export button disabled?
Either the time window is wider than last month or the current filters return no rows. Narrow the window and try again.
Why is this data useful?
It shows which agents developers act on, which comments get rejected or ignored, and where an agent needs tuning. Responding to a comment also feeds agent memory, so interactions are both a measurement and an input.