Engineering Impact
See Baz’s impact on code correctness, bug prevention, and engineering quality.
The Engineering Impact Dashboard helps teams understand the real impact Baz has on code correctness, bug prevention, and engineering quality.
This dashboard appears in the Insights section of the product and provides a consolidated view of how Baz influences the stability and reliability of your codebase.
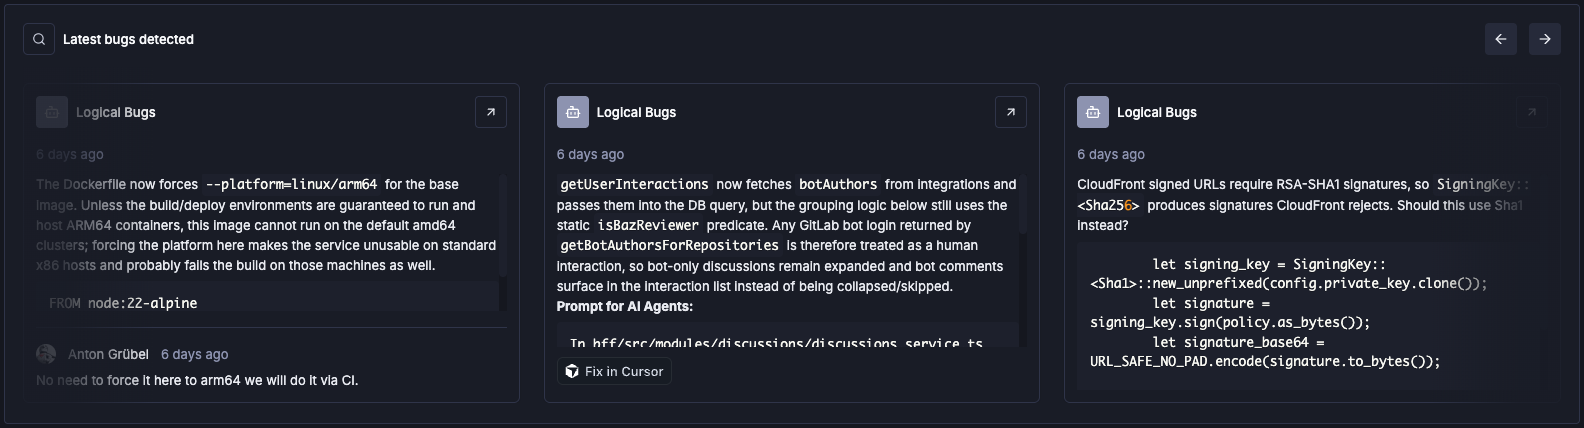
Latest bugs detected
- The carousel that highlights notable bugs Baz surfaced, paired with user reactions and interactions.
- Each item includes:
- The original Baz comment
- User response (e.g., acceptance, confirmation)
- The reviewer that detected the issue
- Clicking an item takes you to the Interactions page and opens the relevant interaction drawer, allowing full context exploration.
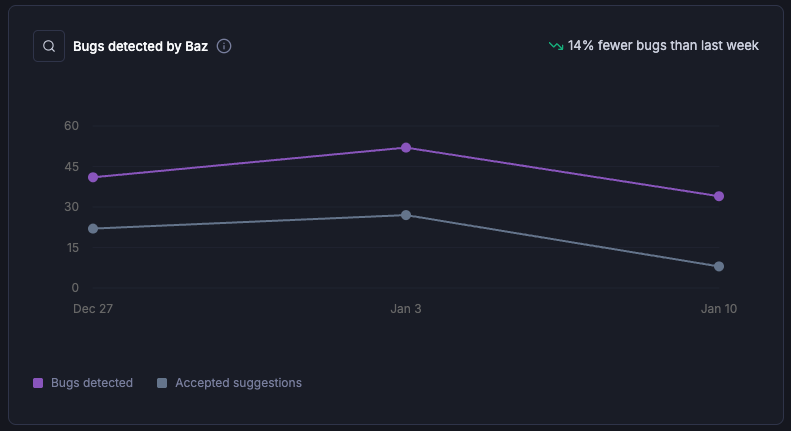
Bugs detected by Baz
- This graph shows the total number of code correctness bugs Baz has identified over the selected time range.
It includes issues detected by the following built-in reviewers:- Logical Bugs
- Breaking Changes
- Type Inconsistencies
- The chart displays two lines:
- Total - All bugs detected by Baz during the selected window.
- Accepted - Bugs that were acknowledged by users through positive interactions or accepted suggestions.
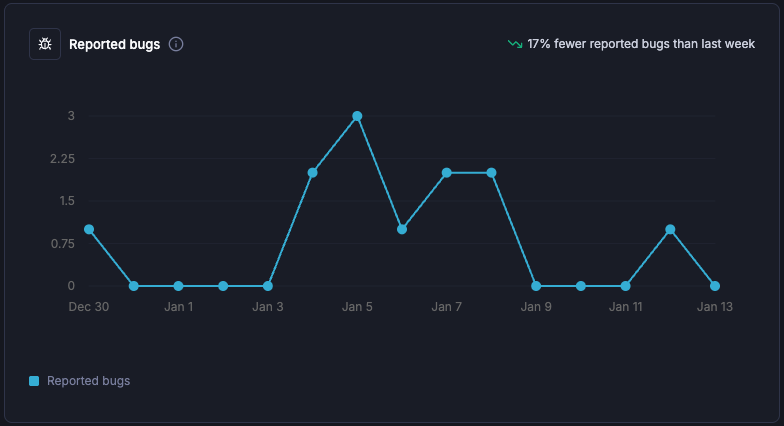
Reported bugs
- This graph tracks the number of bugs that were reported after release and logged in your connected ticketing system. It reflects issues identified by users or QA in production or post release environments.
- The count includes all Bugs created in the ticketing system within the selected time range.
- This metric helps teams understand post release quality.
PR Pick Up Time
- This graph tracks the median duration it takes for a human reviewer to first interact with a pull request after it has been opened.
- The chart displays the Median time to pick up across the selected time range.
- This metric helps teams understand review responsiveness and identify initial bottlenecking in the code review lifecycle.
.png)
PR Time To Merge
- This graph shows the median duration a pull request spends in the pipeline, measuring the time from initial creation to final merge.
- The chart displays the Median time to merge across the selected timeframe.
- This metric helps teams understand overall cycle time, delivery velocity, and the efficiency of the code integration process.
.png)